Education Hub
Candlesstick Patterns
Chart Patterns
Forex Analysis
Forex Education
RSI Candle Indicator: What it means, and how to use it?

Overview
The RSI candle indicator is a technical indicator that calculates the RSI value of the high, low, open and close price of a candlestick and then draws a rsi candle on the candlestick chart. It is a unique idea to add a confluence of overbought and oversold conditions.
RSI is a very useful indicator, and retail traders use it. But due to market noise and other factors, relying entirely on the RSI indicator is difficult. To become a profitable trader, you always need a confluence of price action with this indicator. Otherwise, you cannot make a profit using the RSI indicator.
With this RSI candle indicator, I will use the Pin bar candlestick with this indicator to make a trading strategy. So kindly continue reading to learn the trading strategy. I will explain from A to Z.
What is the RSI candle indicator?
RSI means relative strength index. The candle is another term that is attached to the RSI. It means this indicator will not plot a single line, but it will plot candlesticks on the RSI chart.
The RSI candle indicator will calculate the rsi value of each candlestick’s high, low, open and close and then plot new candlestick using those calculated RSI values. RSI value ranges from 0 to 100.
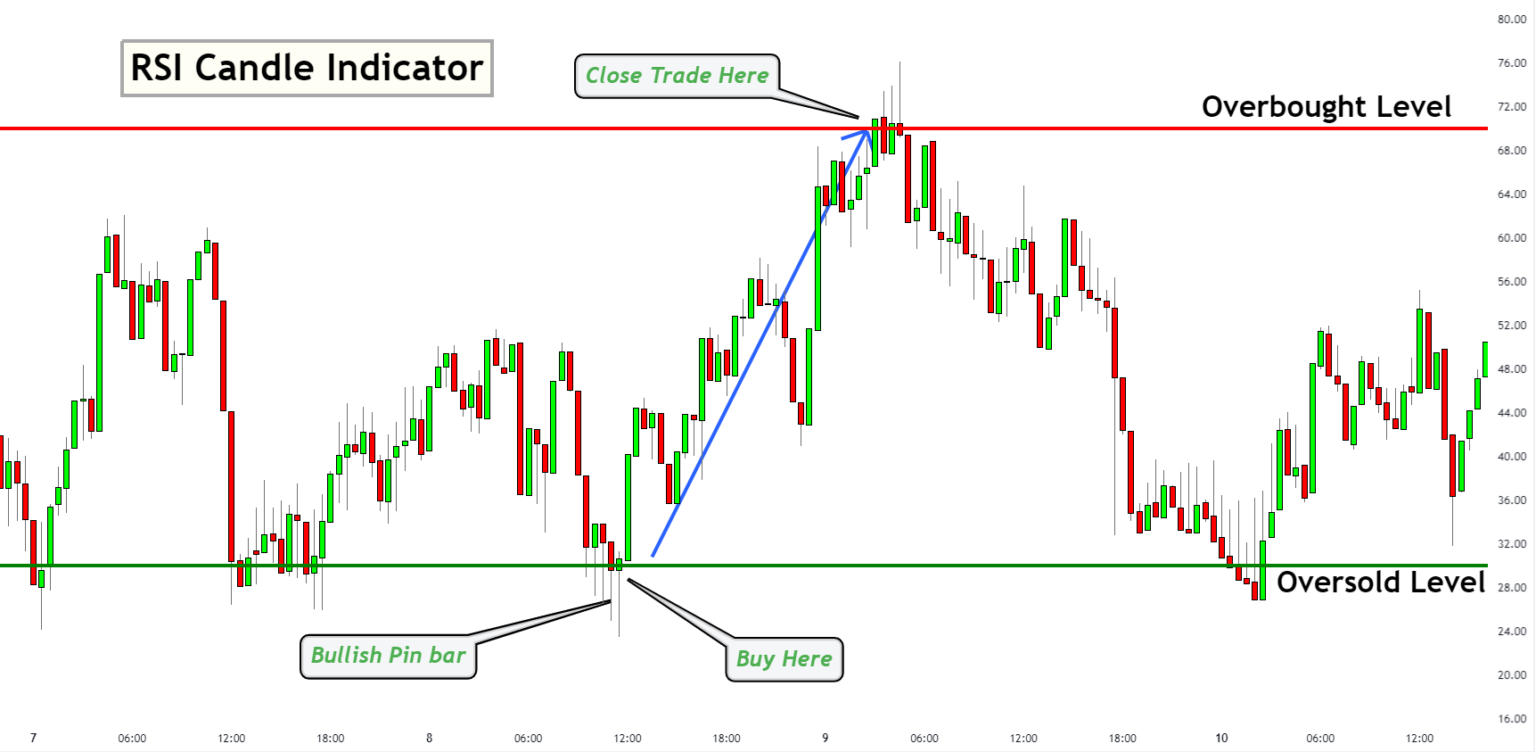
- If candlesticks form above the 70 level, then the price is in the overbought region.
- On the other hand, if candlesticks form below 30, then it means the price is in the oversold region.

The function of Red and Green lines
When you add the indicator to the chart, you will see a red line at 70 levels and a green line at 30.
One important thing you should understand is that you will not see the actual price of currency pair of financial assets after adding this indicator. Because this indicator will calculate the RSI value and then will plot accordingly, its value will always range from 0 to 100.
For example, if the EURUSD price is at 1.10000, you will still have a value from 0 – 100 on the price chart after adding the indicator. So before opening a trade, you must read the value of the currency pair from the actual candlestick chart.

The primary function of red and green lines is to provide an easy way to sell and buy from key levels without plotting or finding zones on the chart.
Indicator Settings
There are three input settings that you should use.
Overbought value = 70
Oversold value = 30
RSI length value = 14

I will recommend the following settings to traders. However, you can also try your settings according to your trading strategy. Because each currency pair has its characteristics, you should always optimize the settings according to a financial asset.
For forex traders, I will use the settings displayed above.
How to trade with the RSI candle indicator?
As mentioned above, you shouldn’t use this indicator alone without the confluence of other price action patterns. After the addition of confluences, the winning probability will increase.
Here I will use the pin bar candlestick pattern. If you don’t know how to identify a perfect pin bar candlestick, then read the related article from our blog.
Open a buy trade
- Add the RSI candle indicator to the chart, and it will plot RSI high and low lines with candlesticks.
- Wait for the candlesticks to open or close below the RSI 30 value. At this point, you should wait for the formation of a bullish pin bar candlestick.
- Open a buy trade on the bullish pin bar
- Wait for the price to reach above the overbought zone to take profit levels.

Open a sell trade
- Add the RSI candle indicator to the candlestick chart.
- Wait for the candlesticks to open or close above the 70 RSI value. Then wait for the formation of a bearish pin bar candlestick pattern.
- Open the sell trade on bearish pin bar closing.
- Close the trade when the price enters the oversold region (below the 30 levels).

This is a simple trading strategy using the RSI candle indicator.
I will also recommend you test other chart patterns and candlestick patterns with this indicator. Like you can also use the engulfing pattern, Morning/evening doji star and tweezer candlestick pattern with this indicator. It will also work the best.
The bottom line
Trading with confluence is a way for successful traders, and you should also use this method. RSI candle indicator is a unique concept; if you use it with proper planning, you can create a winning trading strategy.
Frequently asked questions
Yes, there is a difference between both charts. The RSI indicator will also show divergence as compared to the actual price. So, you should make a proper risk management plan before trading on a live account. It is challenging to use stop loss in this trading system.

Yes, it will work in a trending market, but the winning ratio of this indicator will increase a lot in ranging market conditions. I will recommend using this indicator in ranging market conditions.
This indicator is hosted on the tradingview platform in the community section. You can get free access to the indicator after creating an account at tradingview.

