Education Hub
Candlesstick Patterns
Chart Patterns
Forex Analysis
Forex Education
High Wave Candlestick Pattern: Definition & Trading Strategy
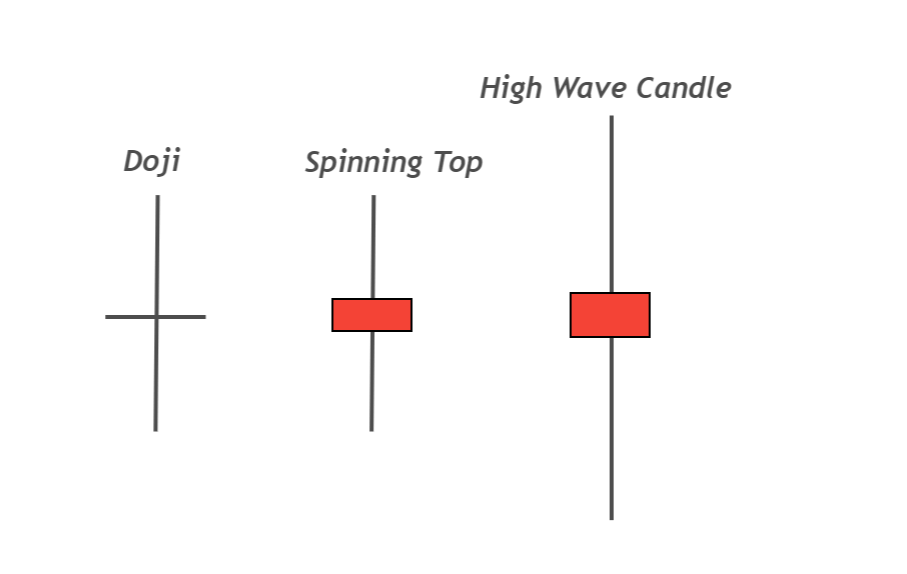
The High wave pattern is a candlestick pattern with large wicks/shadows than the average size of candlestick. The body of the candlestick is tiny as compared to the shadows.
It is like a spinning top or long-legged Doji candlestick. This candlestick pattern shows that market makers are deciding their direction. It is also used as a stop-loss hunting pattern by big traders & institutions.
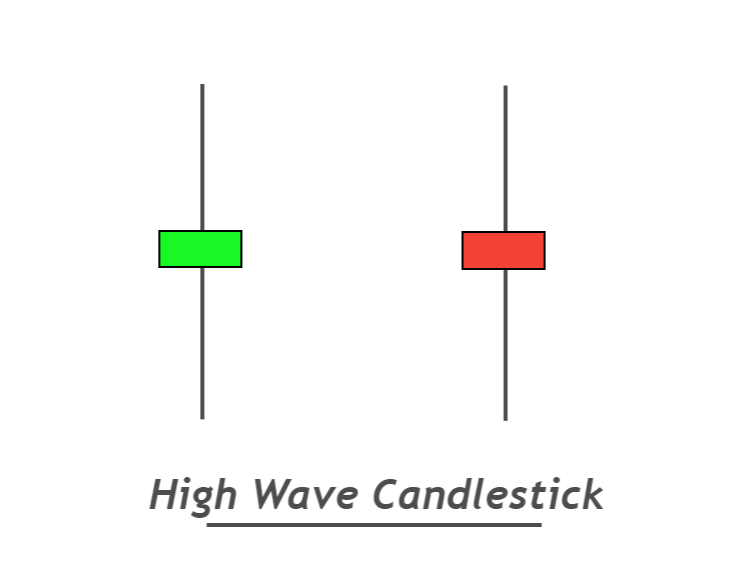
How to identify the High wave candlestick?
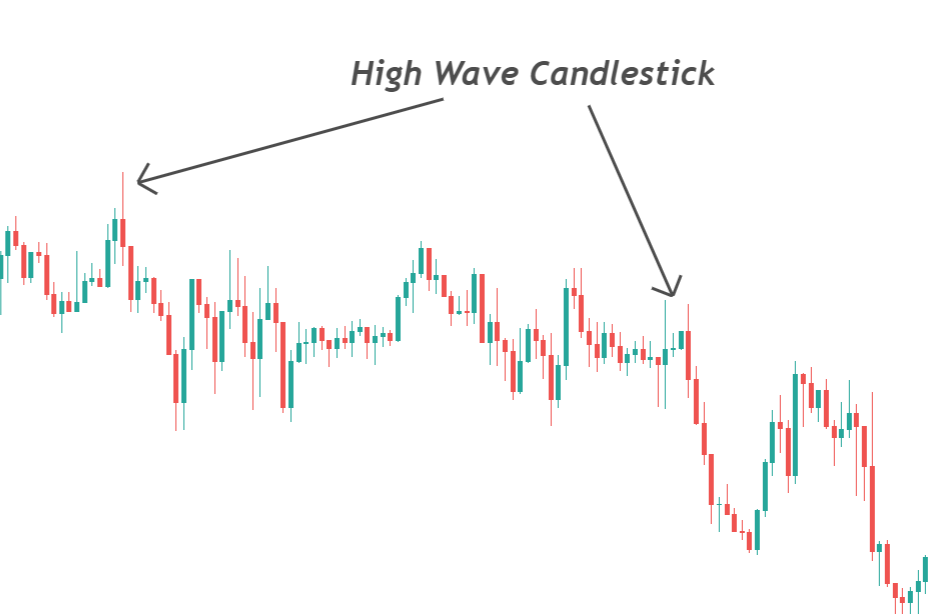
It is a single candlestick pattern, and usually, it forms at support or resistance levels because these are decision points.
I have explained a few points you need to know to identify an excellent high wave candlestick pattern. Here is the guide
- The total size of the high wave candlestick should be greater than the size of the last 20 candlesticks because it is a high wave candlestick. It means big market moves will happen during this duration.
- The body of the candlestick should be smaller. Commonly the body to wick ratio of high wave candlestick is below 20%. Large shadows above or below the candlestick pattern explain the market activity on the chart.
- The color of the candlestick pattern does not matter, and it can be red or green like in a spinning top candlestick pattern.
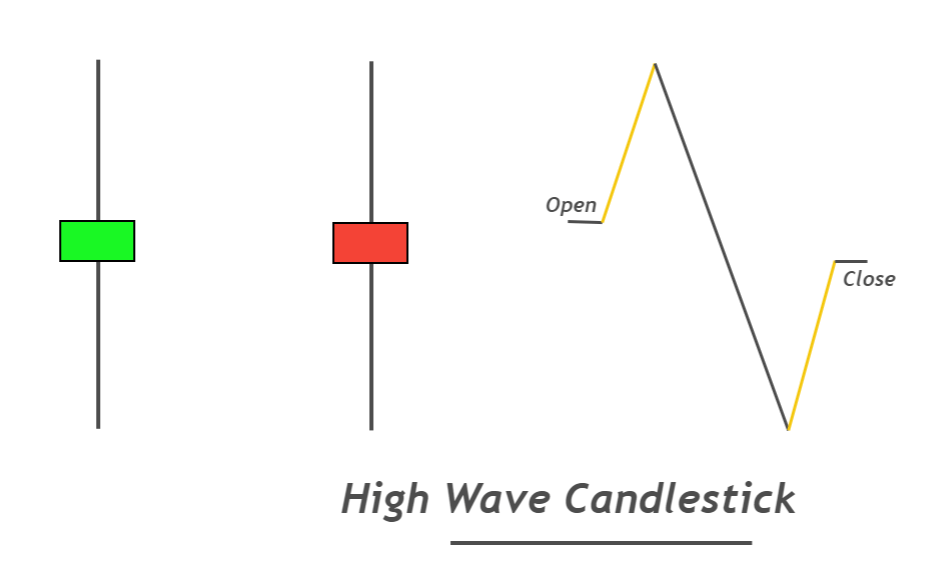
By following the above three points, you will be able to identify the correct high wave candlestick pattern
It would help if you always made some rules to refine the best setups from the crowd.
Best working conditions for the High wave pattern
Every High wave pattern will not work on the price chart. Few conditions help us to trade only good candlestick patterns.
- The high wave candlestick pattern has a low success rate during market conditions. So, avoid trading this pattern during range.
- The winning ratio of the High wave pattern is more significant when it forms at Support/Resistance or Supply/Demand zones.
- Use the Relative strength index indicator to determine overbought and oversold conditions. Then trade at overbought/oversold levels.
High wave Candlestick: Information Table
| Features | Explanation |
|---|---|
| Number of Candlesticks | 1 |
| Prediction | Indecision in market |
| Prior Trend | N/A |
| Counter Pattern | Long-legged Doji |
What does the high wave candlestick pattern tell traders?
The psychology of this pattern is like the top spinning candlestick, but there is a minor size difference.
The high wave candlestick pattern represents that the market makers are making the future decisions of the price.
It is a reversal and a continuation candlestick pattern. The breakout of the candlestick confirms the direction of price.
After forming a high wave candlestick, the price will move towards the low or high of the candlestick, and these price values will act as support or resistance level. The price trend will be confirmed when a breakout of the high or low candlestick happens by the price.

For example,
- Break of high of this candlestick pattern shows that bullish trend will start
- Break of the low of this candlestick pattern represents a bearish trend.
How to trade the high wave candlestick pattern?
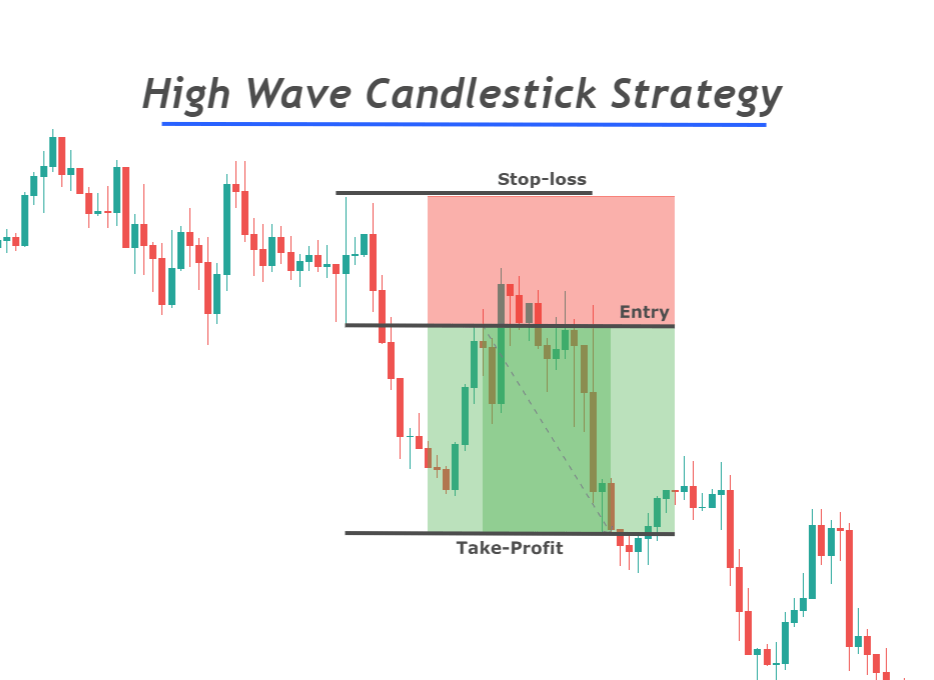
Here I will explain a simple breakout strategy. However, you can also use it for analysis purposes.
Pending buy Stop/sell stop order
Place pending buy stop order above the high of this candlestick pattern and adjust stop-loss below the candlestick’s low.
After buy stop, place pending sell stop order below the low of the high wave candlestick and stop-loss above the high.
When one of the above two pending orders will fill, remove the other pending order. For example, if a buy stop order gets filled, delete the sell stop order.
Risk Reward ratio and Take profit levels
The optimum risk-reward ratio for this trade setup is 1:1.6 RR. You can also extend the take-profit levels by breakeven strategy or using other technical tools. But it would help if you always tried to break even the trade after 1.6 RR.
The Bottom Line
One should keep in mind that it is recommended to follow the rules and guidelines of the high wave candlestick pattern because every candlestick pattern will not work according to our expectations. That’s why adding a confluence of other technical indicators is necessary to increase the winning ratio.
Before trading on a live account, make sure to backtest the trading strategy properly.

