Education Hub
Candlesstick Patterns
Chart Patterns
Forex Analysis
Forex Education
Bullish Inverted Hammer Candlestick Pattern
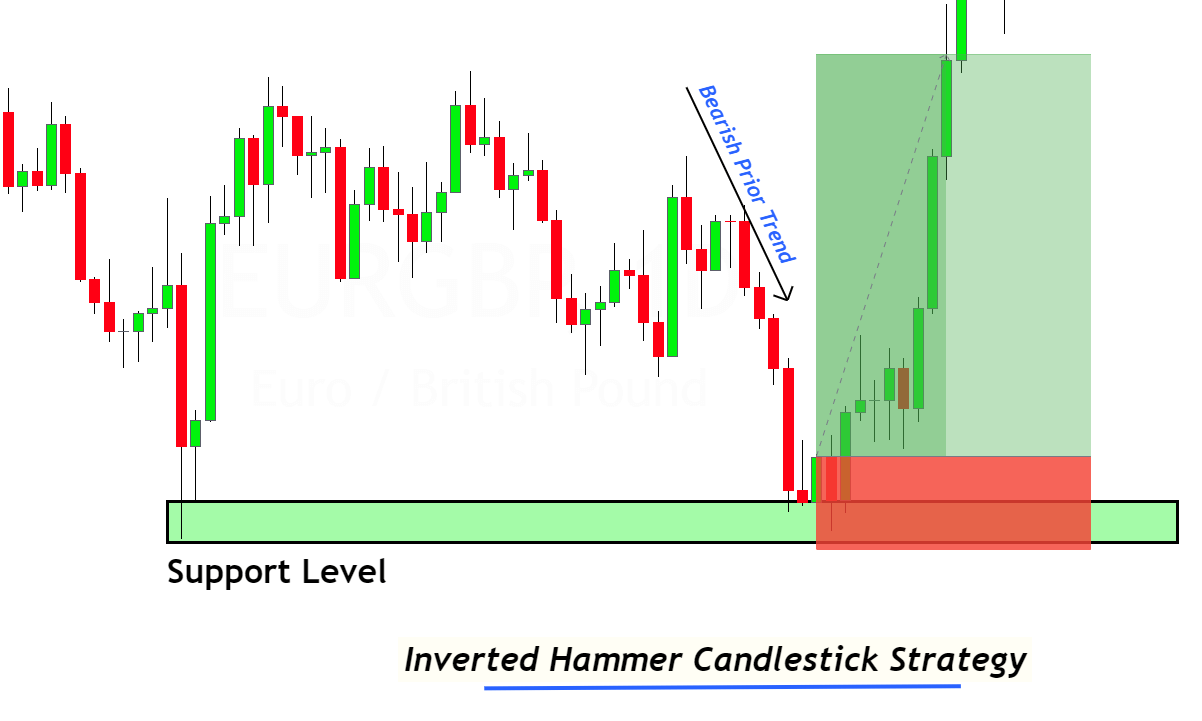
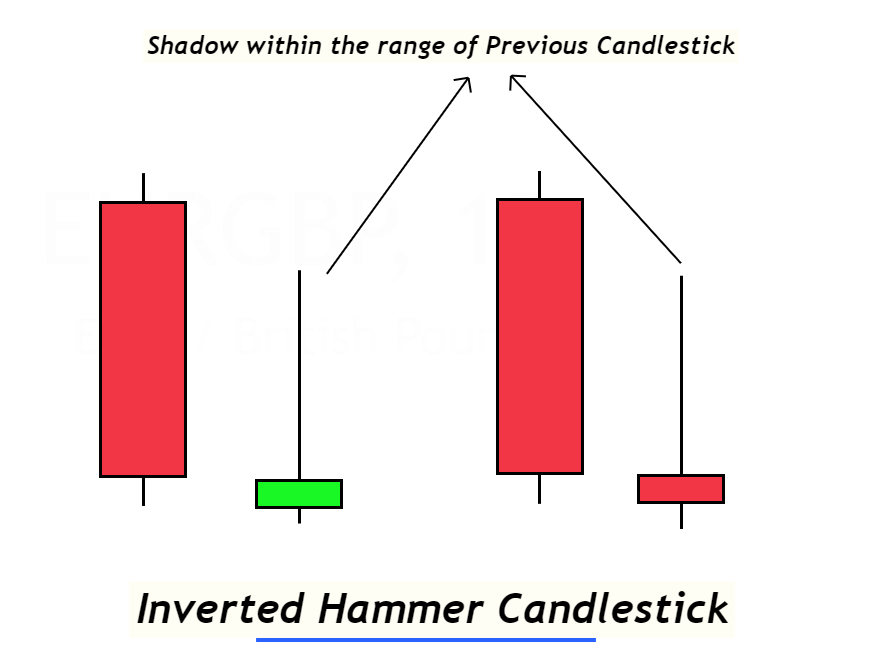
An inverted hammer candlestick is a bullish trend reversal pattern that consists of a single candlestick with a long upper shadow and a small body at the bottom. In an inverted hammer, the long shadow mainly forms in the range of the previous candlestick.
Retail traders use inverted hammer candlesticks to forecast the trend reversal in the market. An inverted hammer symbolizes the accumulation of buy orders in the market. It means buyers will enter the market, starting a bullish trend reversal.
In this article, you’ll learn the structure, significance, trading psychology, and trading signal of the inverted hammer patterns.
How to find the inverted hammer candlestick?
To find the best patterns from the price chart, a retail trader should always add confluences to see the high probability patterns only. Because the market chart is full of noise, it won’t be easy to trade all the candlestick patterns profitably. That’s why we have added a few rules to identify good patterns:
- Structure
- Prior trend
- Location
These three parameters will improve the accuracy of the inverted hammer candlestick pattern.
Structure
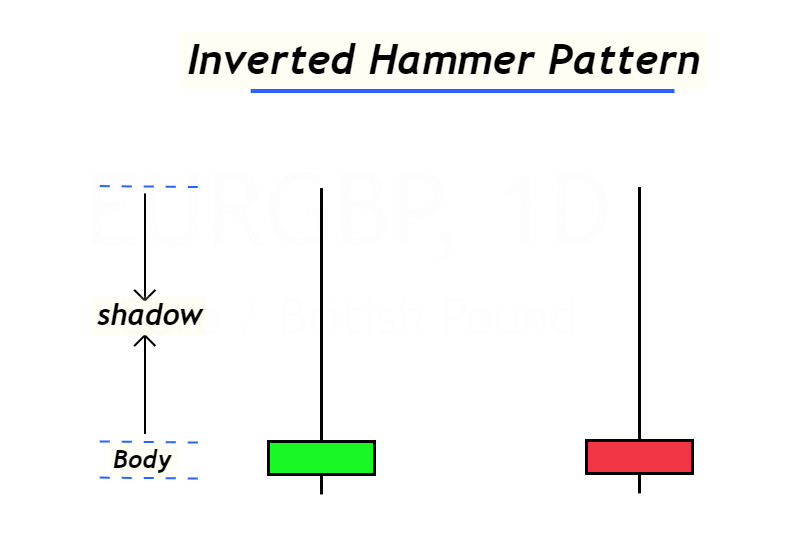
The structure includes the size of wicks/shadows and the candlestick’s body: a long upper shadow and a small body at the bottom in an inverted hammer pattern. The total candlestick consists of 80% of the shadow and 20% of the body.
Prior trend to inverted hammer candlestick pattern
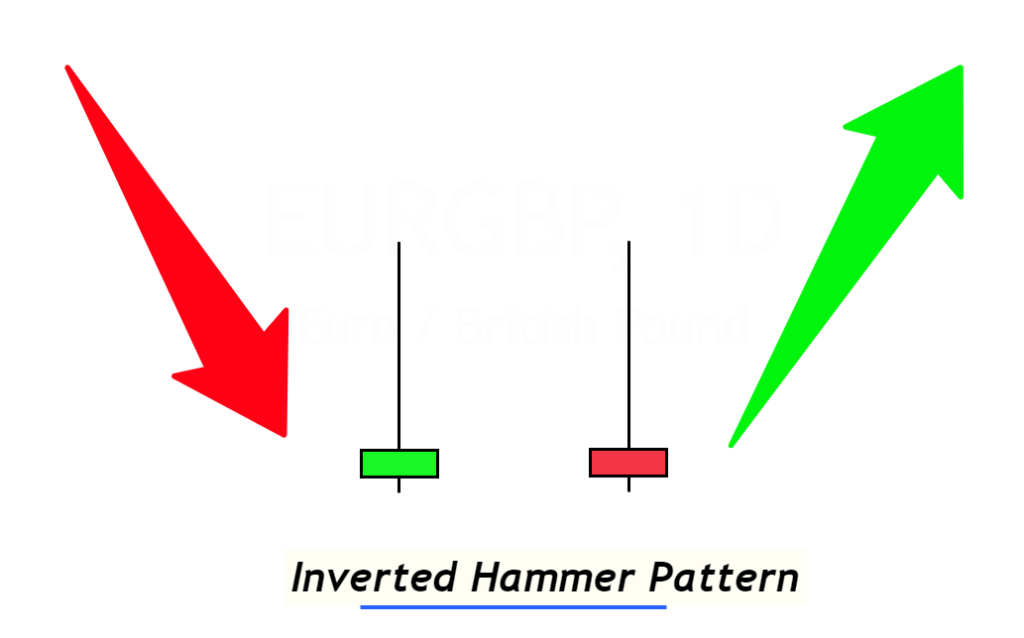
The trend before the formation of the inverted hammer pattern must be bearish. Because if it forms after a bullish trend, the probability of winning will decrease.
Forming three to four bearish candlesticks (lower lows, higher lows) before the inverted hammer pattern is also a good practice.
Location
The first parameter is that it should not form within the range of candlesticks or during sideways market movements because the sense of the pattern changes with the change of location.
For example, if an inverted hammer form after the bullish trend, it will act as bearish trend reversal instead of the bullish trend. Because it is similar to the bearish pin bar.
That’s why the perfect location is the formation of an inverted hammer after the downtrend, and the big shadows must be within the range of the previous candlestick. Look at the image below for a better understanding of this pattern.
What does the inverted hammer pattern tell retail traders?
This is one of the most crucial questions in technical analysis. Because the name of a candlestick does not matter, the sense and trading activity behind a pattern is more important.
As discussed above, the inverted hammer and bearish pin bar are the two candlesticks with the same structure. Still, the trading activity during the formation of this pattern is more important.
For example, before the bearish pin bar, there is always a bullish trend representing that buyers are in control and continuously pushing up the market. Now the market is in an overbought condition, and a bearish pin bar forms with a long upper shadow showing rejection from a strong supply zone or resistance zone. This indicates that sellers have taken control of the buyers, and buyers don’t have enough power to keep the price overbought. Now sellers will come in, and a bearish trend will start.
Due to three factors, overbought, resistance rejection, and long upper shadow showing false breakout, confirms that a bearish trend will start. These factors indicate the market activity during the formation of the bearish pin bar.
In the same way, the activity of traders during the formation of the inverted hammer pattern shows that a bullish trend reversal will happen.
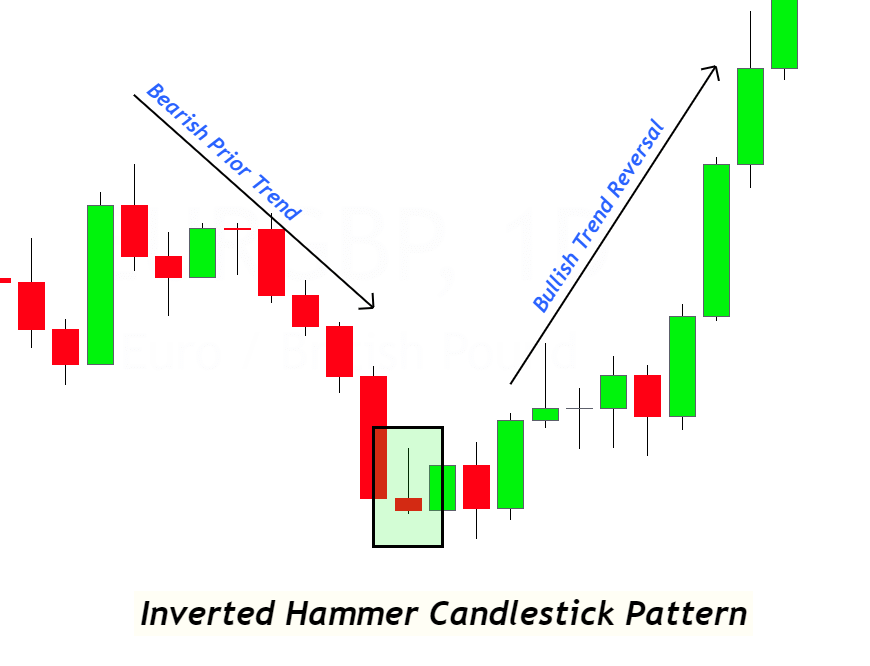
Let’s read the price chart’s market activity during inverted hammer candle formation.
The prior trend before the candlestick pattern is bearish, indicating oversold conditions. Sellers are trying their best to decrease the price in the market. But after forming an inverted hammer pattern at a support zone, a bullish trend reversal starts. Because during this pattern, sellers could not keep the price in a bearish trend while buyers pushed the price and engulfed the 60 to 70% portion of the previous bearish candlestick.
It shows the slowdown of the bearish trend at the resistance zone and in an oversold condition, which gives buyers a chance to increase the price by starting a new bullish trend. This is the simple psychology of retail traders behind the chart.
The inverted hammer candlestick pattern symbolizes the slowdown of the bearish trend.
Intraday Trading Strategy for inverted hammer candlestick
A candlestick pattern is always traded with the confluence of other technical tools like the Fibonacci level, support zone, and technical indicators.
Tip: the major drawback of the inverted hammer pattern is that it does not tell a trader about the target levels. It only shows the buy order opening level and stop loss level on the price chart.
Here’s the explanation of order opening and stop-loss level when an inverted candle forms on the price chart.
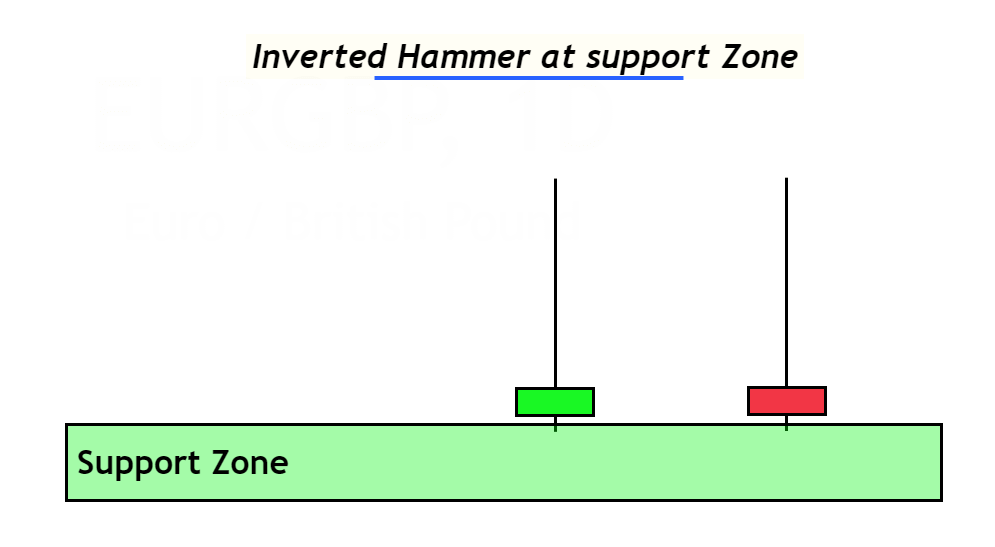
Inverted hammer at support zone
The support zone indicates a bullish trend reversal in the technical analysis. On the other hand, an inverted hammer candlestick also shows the same analysis. So when two technical patterns form at the same time, then the probability of trend reversal increases. So it will be best to always look for a confluence-like support zone.
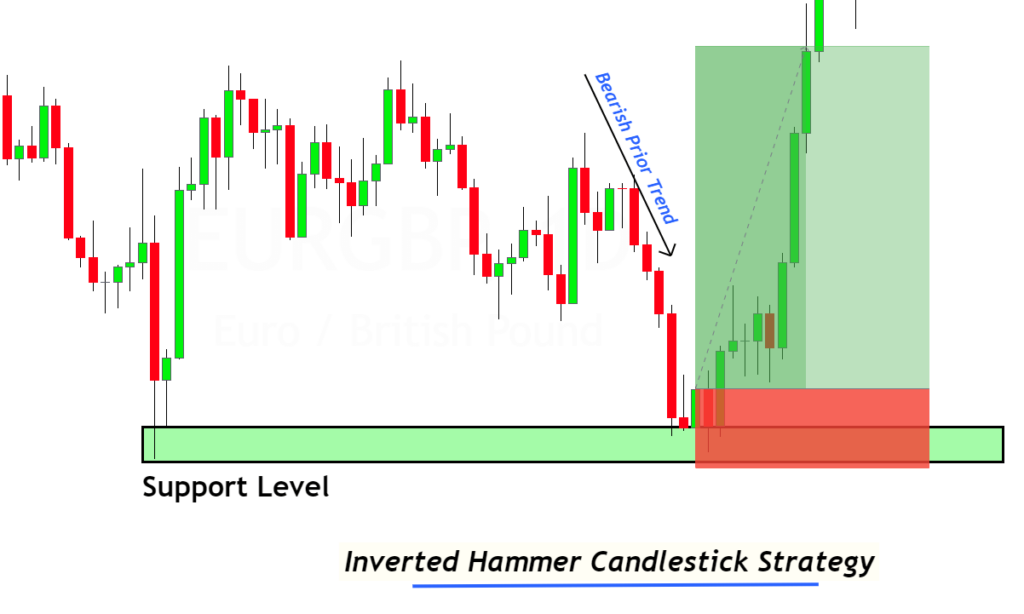
Open buy order
When inverted hammer pattern forms, then wait for the next candlestick. If a bullish candlestick forms after this pattern, open a buy order instantly and place a stop-loss below the low or below the support zone. You should choose the lowest one while adjusting the stop-loss.
If a bullish candlestick does not form after the inverted hammer pattern or bearish trend continues, do not open a buy trade.
The Bottom line
Learning candlestick patterns is the basis of technical analysis in trading. However, understanding the patterns correctly is more important. I will also tell new retail traders that you shouldn’t even need to remember the names of candlestick patterns. Still, you should try to predict the market activity behind every candlestick pattern. This will make you a winning and profitable trader, which are characteristics of a professional trader.
Make sure to backtest this pattern at least 100 times so you can master the inverted hammer pattern.
Frequently Asked Questions
What is the difference between the bearish pin bar and the inverted hammer candlestick pattern?Bearish pin bar and inverted hammer both candlesticks have the same structure, but both predict an opposite trend reversal. The inverted hammer indicates the bullish trend reversal, while the bearish pin bar shows the bearish trend reversal in the market.Although the structure of both candlesticks is the same, they have different trading activities and locations. Inverted hammer forms after the bearish trend while other forms after the bullish trend.
Should the inverted hammer pattern have a green or red color?
The color of this candlestick pattern does not have any importance. Only the location of the inverted hammer pattern matters. It will always predict a bullish trend reversal in the market either this candlestick pattern forms in red or green color.
Which pattern has high winning accuracy: Inverted hammer or bullish hammer?
Both candlestick patterns have different winning accuracy. But as a forex trader, I prefer the bullish pin bar over the inverted hammer pattern. Because inverted hammer mainly shows slow down of the bearish trend while bullish hammer pattern shows a false breakout of support zone, a strong symbol of reversal in the market. Because market makers always try to give a false breakout before more significant market trends. That’s why bullish hammer has a higher winning ratio in technical analysis.

