Education Hub
Candlesstick Patterns
Chart Patterns
Forex Analysis
Forex Education
Bearish Kicking Candlestick Pattern: Full Trading Guide

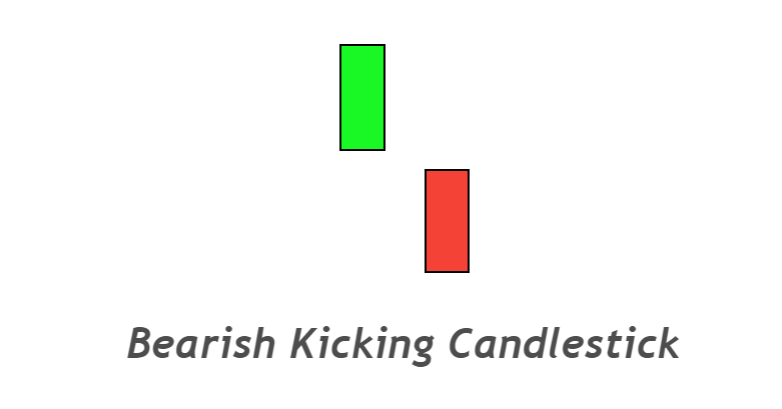
Bearish kicking is a price trend reversal candlestick pattern consisting of two opposite-colored marubozu candlesticks with a gap between them. It will mostly form at the top of the price chart or Resistance/supply level.
The bearish kicking candle is used to forecast an upcoming bearish trend in the market. It forms mainly on the price chart of stocks or indices. In some cases, It also acts as a trend continuation candlestick. But I will explain a strategy to trade the reversal candlestick with the trend to make high probability trade setups.
How to identify bearish kicking candlestick?
To find a bearish Kicker (kicking) candlestick on the chart, you need to follow a few sets of guidelines.
- A bullish marubozu candle will form on the chart, and it is the first candlestick of the pattern.
- After bullish marubozu, the market will open with a gap down, and the second candlestick will open below the closing price of the bullish marubozu.
- The second candlestick of this pattern is a significant bearish marubozu candle that indicates the massive momentum of sellers.

The above criterion is mandatory to identify ideal kicker candlestick patterns because you should refine a trading pattern to increase the winning ratio.
On the other hand, the one who is trading a bearish-kicking candlestick pattern blindly without the addition of confluences will not make a profit.
Bearish kicking: Information Table
| Features | Explanation |
|---|---|
| Number of Candlesticks | 2 |
| Prediction | Bearish trend reversal |
| Prior Trend | N/A |
| Relevant Pattern | Kicker candlestick |
The psychology behind the kicking candle
Reading a candlestick pattern will make you understand the psychology of big traders who are trading behind the chart. It will also help you in making good decisions.
Big traders always want to deceive retail traders in many ways. Institutional traders will always win. You cannot beat them. The profitable manner is to trade with big institutions, not with the 95% of retail traders who lose in the market.
You can find the path of big institutions by reading the price. For example, in the case of the bearish-kicking candlestick, a bullish marubozu is a complete indication of bullish trend continuation because a big white body represents the momentum of buyers in the market. This candlestick will make the retail traders place buy orders.
But after bullish marubozu, the price will open with a gap down. This massive price decline represents the filling of sell orders of institutional traders. Then after the gap, a significant bearish candlestick will confirm the bearish trend.
Then retail buyers will face losses, and it is time for you to enter the market and trade with big traders in the Bearish direction.
Bearish kicking candlestick trading strategy
It is a simple trading strategy that is made by the combination of an exponential moving average and bearish kicker candlestick pattern.
Kicker pattern indicates a reversal in the market, and EMA will help in trading that reversal in the direction of trend only.
How to trade kicking candlestick patterns?
The first condition you need to check is that price should be below the moving average. When the price approaches the moving average line and a kicking candlestick form, open a sell trade and place a stop-loss above the high of the candlestick pattern.
Hold the trade until trade achieves a 1:2 risk-reward ratio. You can also use the Fibonacci tool for this purpose.
The Bottom Line
It is recommended to trade kicker candlestick with other technical analysis tools like moving average.
Before using it for technical analysis in live trading, make sure to backtest this candlestick properly.

