Education Hub
Candlesstick Patterns
Chart Patterns
Forex Analysis
Forex Education
Bearish Belt Hold: A Reversal Candlestick Pattern

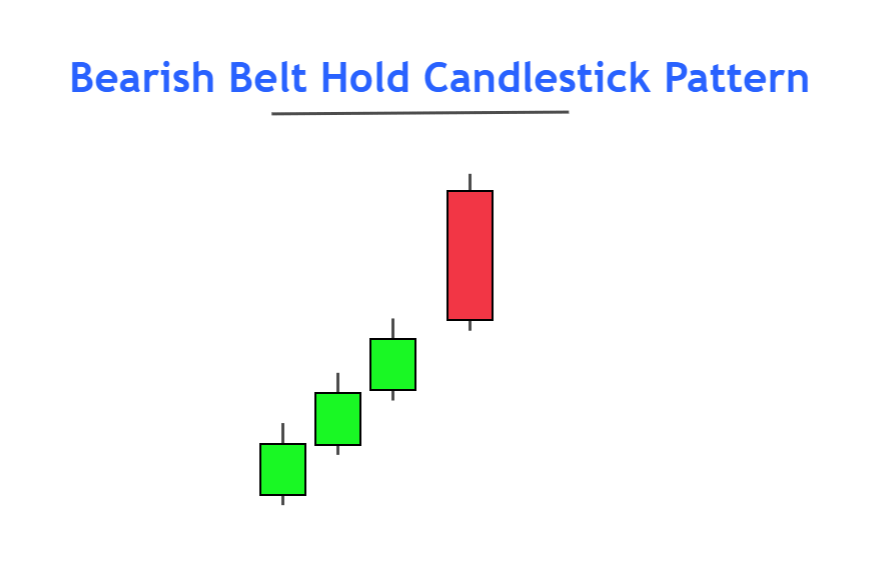
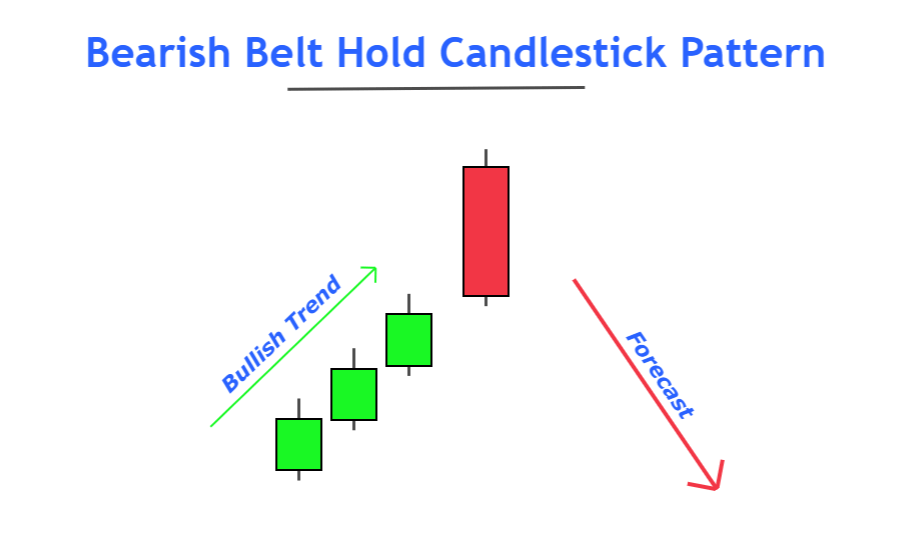
Bearish belt hold is a trend reversal candlestick pattern that changes bullish price trend into the bearish price trend. After the formation of three bullish candlesticks, a long bearish candlestick forms at the top of the price chart resulting in a price trend reversal.
The belt-hold price pattern usually works in stocks and indices. There is a very low probability of belt hold pattern in major currency pairs because of high volatility.

How to identify a bearish belt hold?
To find out bearish belt hold pattern on the price chart, follow the following steps
- Look for three bullish candlesticks making higher highs and higher lows on price chart
- A big bearish candlestick making a new high and closing inside the range of previous candlestick should form at the top of price chart.
- Three bullish candlesticks indicate bullish trend. These candlesticks should have small body sizes representing slow upward price trend.

The third point is not a necessary action for the belt hold pattern. It is used to identify slow market trends. Because the market takes reversal after a false breakout or after overbought/oversold conditions. These three candlesticks increase the probability of trend reversal.
Bearish Belt hold: Information Table
| Features | Explanation |
|---|---|
| Number of Candlesticks | 4 |
| Prediction | Bearish trend reversal |
| Prior Trend | Bullish trend |
| Counter Pattern | Bullish Belt Hold |
What does a bearish belt hold pattern tell traders?
It is compulsory to know the reason behind the formation of each candlestick pattern that you are going to trade. if you only know that belt hold is a reversal candlestick pattern, then you will not be able to make good decisions while trading. Because real market conditions are different from ideal price patterns. To tackle this situation, you should be able to understand the logic behind each price pattern.
In the bearish belt hold Pattern, three candlesticks indicate that buyers are controlling the market but they are becoming weaker with time and sellers are preparing to sell. But after three consecutive bullish candlesticks, a big bearish candlestick opens with a gap and then engulfs the gap.
This gap is actually a false breakout that captures the orders of the late buyers. Price then filled the gap and closed within the range of the previous bar overcoming the forces of buyers. After an engulf at a key level, sellers have started a new bearish trend and now they are controlling the market.
How to trade bearish belt hold?
Trading candlestick patterns is always done with the confluence of other technical analysis tools. Here I will explain to you a strategy to trade bearish belt hold effectively.
This strategy consists of two confluences
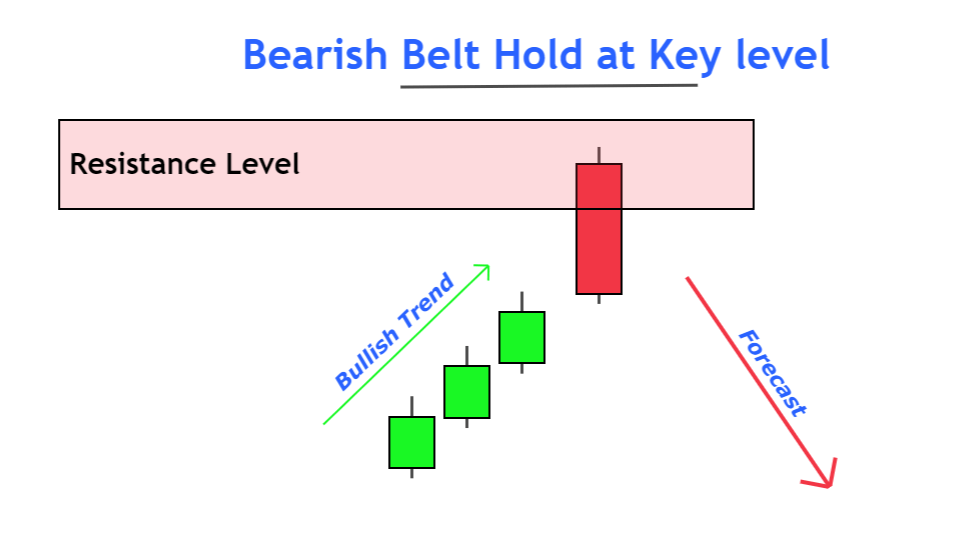
- Resistance or supply zone
- Bearish belt hold

Open a sell trade
The first step is to look for a strong resistance or supply zone at the top of price swings. There is a strong probability of price trend reversal from the resistance zone. Bearish belt hold is also a trend reversal signal. When we will combine both indicators then the probability of price trend reversal will increase.
After the formation of the Bearish belt hold at the resistance zone, open a sell trade instantly.
Stop-loss level
The safe stop-loss level is above the resistance zone. That’s why stop-loss is always placed above the resistance zone. If the high of the bearish candlestick is above the resistance zone then you should prefer to place a stop-loss above the high of the candlestick.
Take-profit Level
Close 75% of the trade at 1:1 risk-reward. Then hold the rest of the trade until it reaches 1:2 risk-reward.
Conclusion
I have explained the best working conditions for this candlestick pattern. You should not trade a single candlestick pattern without the confluence of other technical parameters for example overbought or oversold conditions.
Because the price pattern is natural. Ups and downs are part of price patterns. You should try to analyze the price swings on the chart and trade accordingly by addition of confluences like bearish belt hold pattern.

