Education Hub
Candlesstick Patterns
Chart Patterns
Forex Analysis
Forex Education
A Complete Guide to Choppiness Index Indicator in Trading

Introduction to Choppiness index indicator
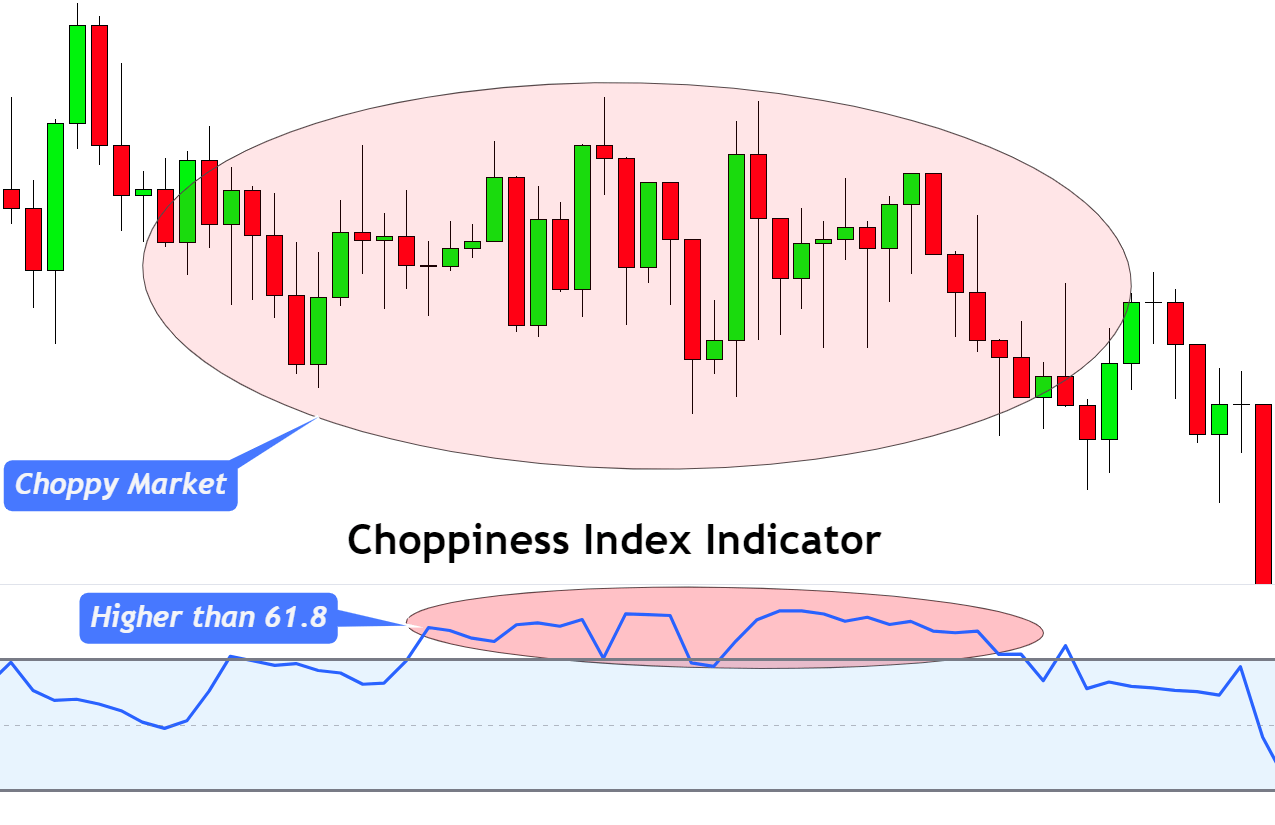
The Choppiness index is a technical indicator that finds the ranging and trending market conditions. It determines whether the market is choppy or non-choppy.
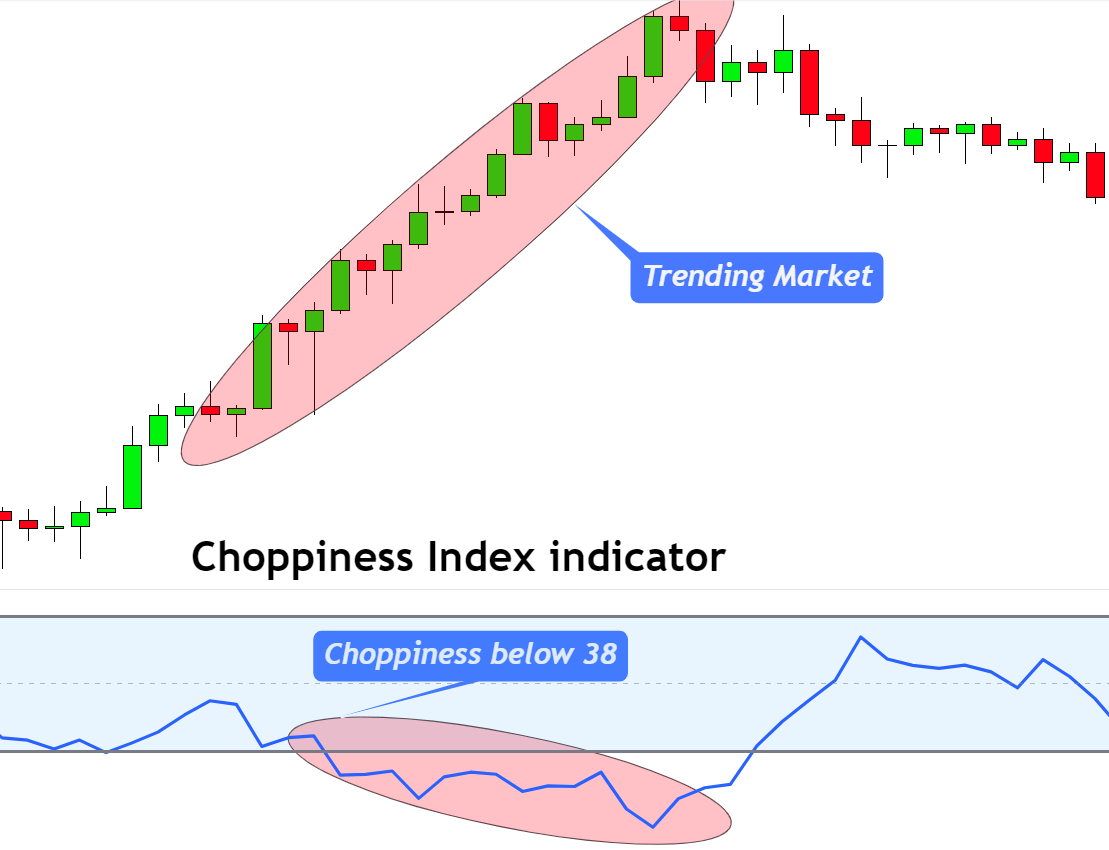
The choppy market represents the ranging market conditions, while the non-choppy market represents the trending market conditions.
So choppiness index indicator helps traders in finding the choppiness of the market. Because the success of trading strategies varies in different market conditions, some strategies work well in trending conditions while others work perfectly in choppy market conditions. So we can use the indicator to determine the optimum market conditions for trading strategy.
Working of choppiness index indicator
The choppiness index indicator is a line that oscillates between 0 and 100. This line shows information related to market choppiness.
Lower market choppiness
If the choppiness line Is below the 38 level, then the market choppiness is lower. It means the market condition is tending. So if you’re a trend trader, there are the right market conditions for you.

Higher market choppiness
If the choppiness line is above the 61.8 level, the market choppiness is higher. It indicates that the market is ranging. If you’re a range trader, this is a suitable condition for you to trade.

Retail forex traders use the Fibonacci numbers in the choppiness index indicator to determine the market conditions. Fibonacci is a great tool that works based on natural patterns. That’s why the probability of winning this indicator is higher.
Best settings for choppiness index
The choppiness index indicator calculates the data of specific number of candlesticks. the optimum period for this indicator is 14. it means it will measure the data from the last 14 candlesticks.
| Inputs | Values |
|---|---|
| Period | 14 |
| Higher Choppiness | 61.8 |
| Lower Choppiness | 38.2 |
What does the choppiness indicator tell traders?
The choppiness index indicator acts as a confluence for filtering the market environment. Because you cannot trade in all market environments, some strategies work in a trending market environment. Such strategies give a much higher winning ratio during the trend and fail during the market structure. So the overall profit potential decreases.
Traders use the choppiness index indicator to filter the trading environment. Because if you avoid trading with a trend trading strategy in the choppy market, your strategy’s winning ratio will be higher.
In the choppy trading environment, support and resistance trading strategies work the best. Bollinger bands indicator also works well during a choppy environment.
How to trade with the choppiness index indicator?
There are two ways to trade with the choppiness index indicator.
- On a higher choppiness index
- On a lower choppiness index
Higher choppiness index
Market conditions will range on a higher choppiness index, and its value must be greater than 61.8. So, in these market conditions, we prefer to trade support resistance zones and key levels.
During this condition, a trade should plot a resistance zone at the top and a support zone at the bottom by analysing the price pattern.
We can combine candlestick patterns with support resistance zones during market conditions. For example, when the price comes to the support zone, then wait for the formation of bullish candlestick patterns. After a bullish candlestick pattern, open a buy trade and close it once it touches the resistance zone.
On the other hand, open a sell trade from the resistance zone with confirmation of a bearish candlestick pattern and close trade at the support zone.
During all these conditions, the choppiness index should remain above 61.8.
Lower choppiness index
These conditions are the most favourable conditions for trading. Because during a low choppiness index, market conditions are trending. The high-risk reward trades mostly happen during the trending market.
There are many ways to trade during trending market conditions. A simple way is by using moving averages and candlestick patterns.
When the price stays above the moving average line, it means a bullish trend. Open buy trades on bullish candlestick patterns and close the trade on the moving average and price crossover. In the same way, the sell trade setup will work when the price is below the moving average line.
The choppiness index line should stay below the 38 levels during the trending conditions.
The bottom line
First, a retail forex trader should identify the nature of the trading strategy. Then he should use appropriate indicators to increase the winning ratio. The Choppiness index indicator is perfect for you to identify the market nature and then use it in your trading strategy.
I highly recommend you backtest the indicator properly before using it in your strategy.

 GBPUSD → A false breakout draws a pin bar. Sellers are winning 5/24/2024
