Education Hub
Candlesstick Patterns
Chart Patterns
Forex Analysis
Forex Education
Higher High and Lower Low Indicator

Definition
The higher high and lower low indicator is a trend-finding indicator that analyzes the peaks and dips in a market to find the trend. This indicator also helps in finding the valuation of the assets. There are two types of general trends in the forex and stock market.
- Uptrend
- Downtrend
Success and positive trading experience depend on understanding and utilizing these two trends. Each trend informs us about the market and impacts the trading strategy. The higher high and lower low indicator provide us with information about the utilization of uptrends and downtrends to improve our trading experience.
Purpose of using the HH & LL indicator
As I have told you earlier, this indicator is all about market trends. So, the basic purpose of this indicator is to determine the market trends in order to formulate a trading strategy. The main purpose of this indicator is as follows.
- To find out the uptrend, which involves higher highs and higher lows.
- To determine the downtrend, which includes the lower highs and lower lows.
Significance
The higher high and lower low concept of the market is gaining importance in modern-day trading. The key significance of this indicator is as follows.
- It helps in determining the market trend.
- This indicator is helpful in finding the highest and lowest price of an asset.
- It helps in generating buy/sell signals.
- This indicator aids in formulating a good trading strategy.
- The higher high and lower low indicator provides a broad picture of the market.
- It helps a trader make well-informed decisions.
Working of the Higher high and lower low
The working of this indicator is very user-friendly and easy to understand. This indicator is based on your key terms.
- Higher highs
- Higher lows
- Lower highs
- Lower lows
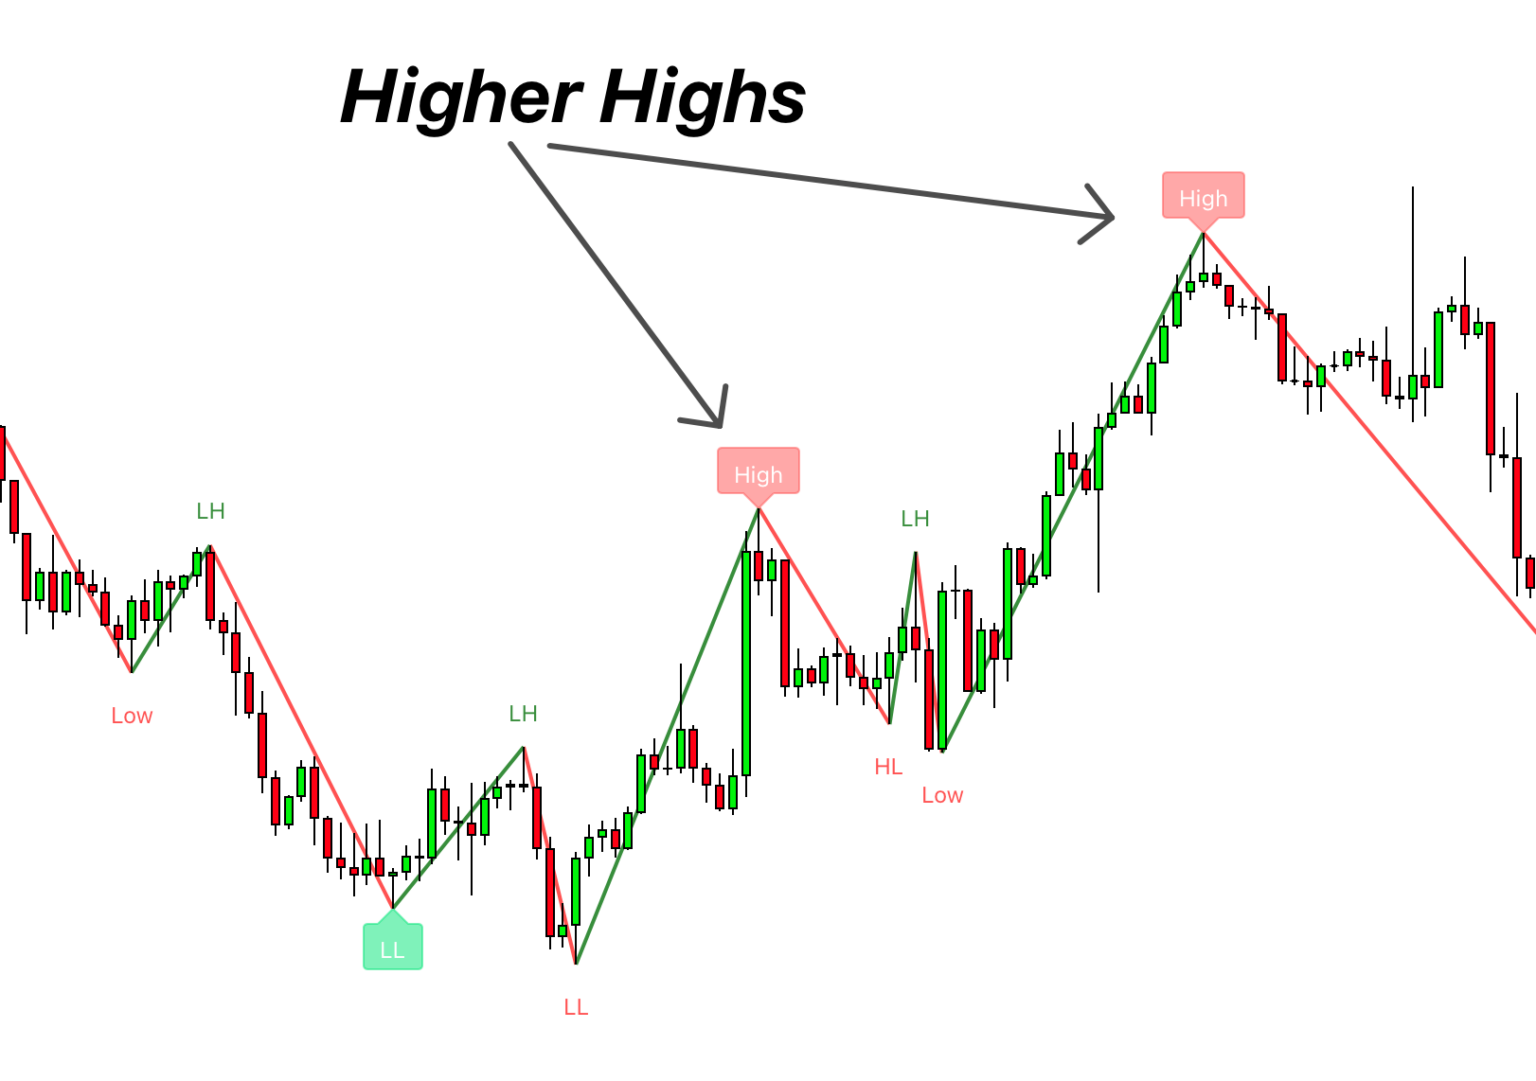
Higher highs (HH)
In trading, every new day brings a new price for an asset. If the price of an asset is closer to a higher level in contrast to the previous day. This phenomenon is known as higher highs. The higher highs for the peaks in a candlestick chart.
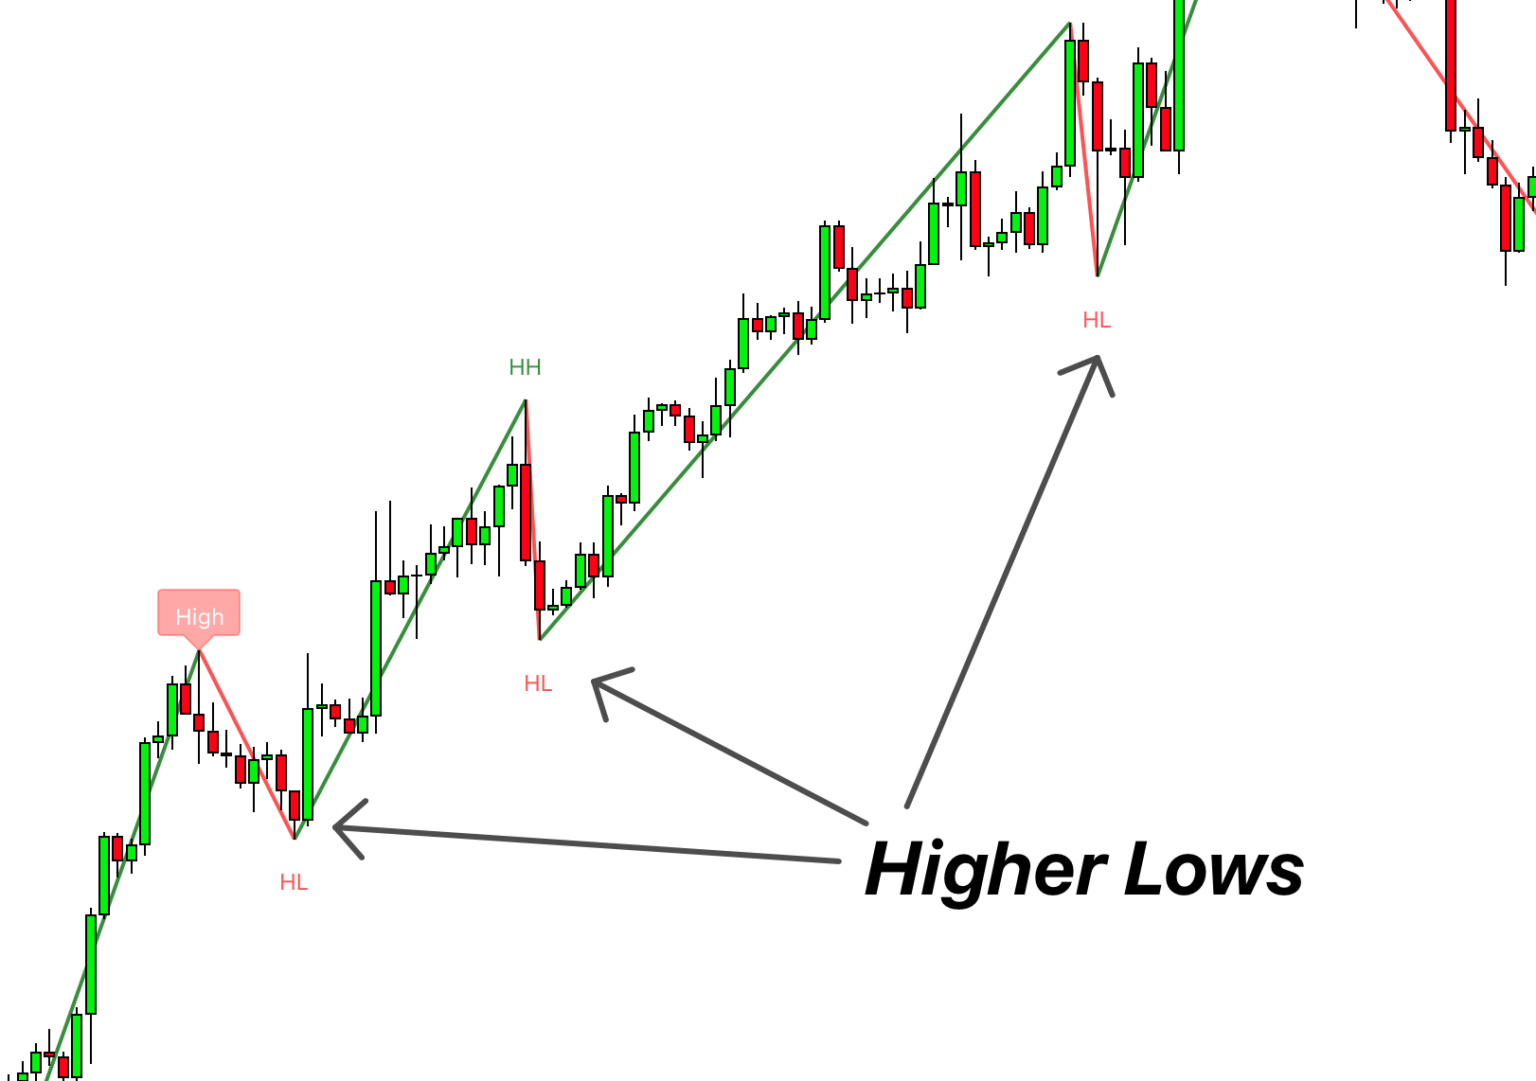
Higher lows (HL)
If the candlestick chart shows the low prices, but these low prices are still higher than the previous day’s lows. It is known as higher lows.
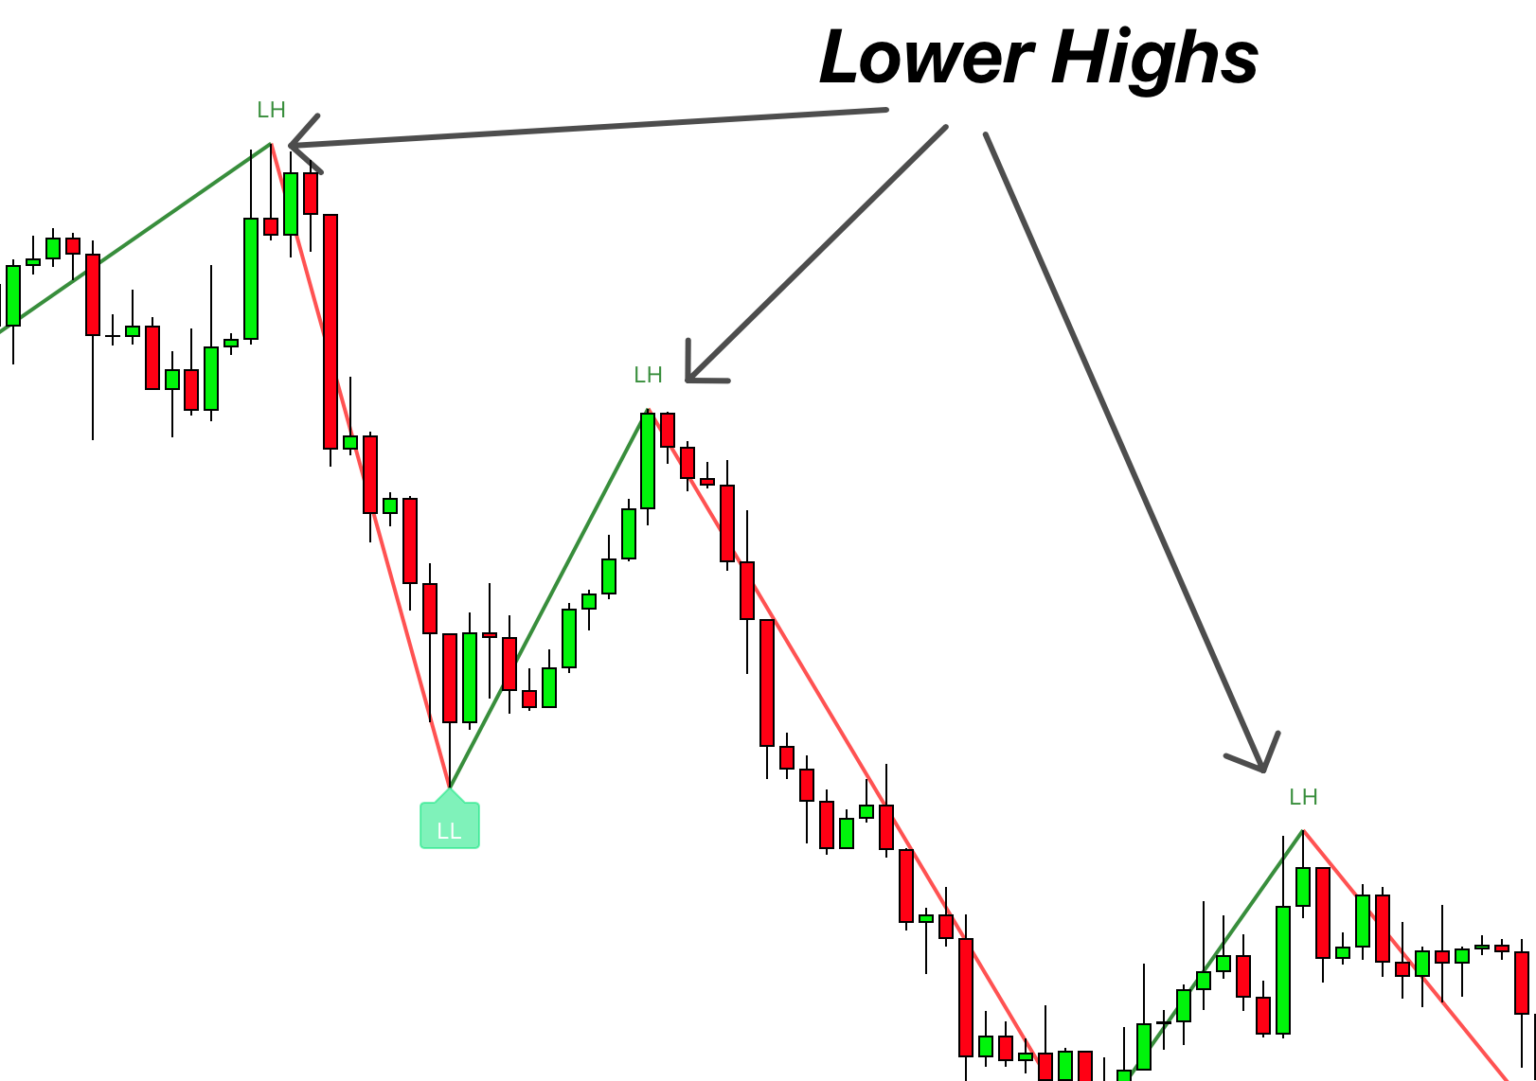
Lower highs (LH)
In a bearish market, the price of an asset forms a new high, which is lower than the previous day. The phenomenon of lower highs indicates that the market is about to face a downtrend.
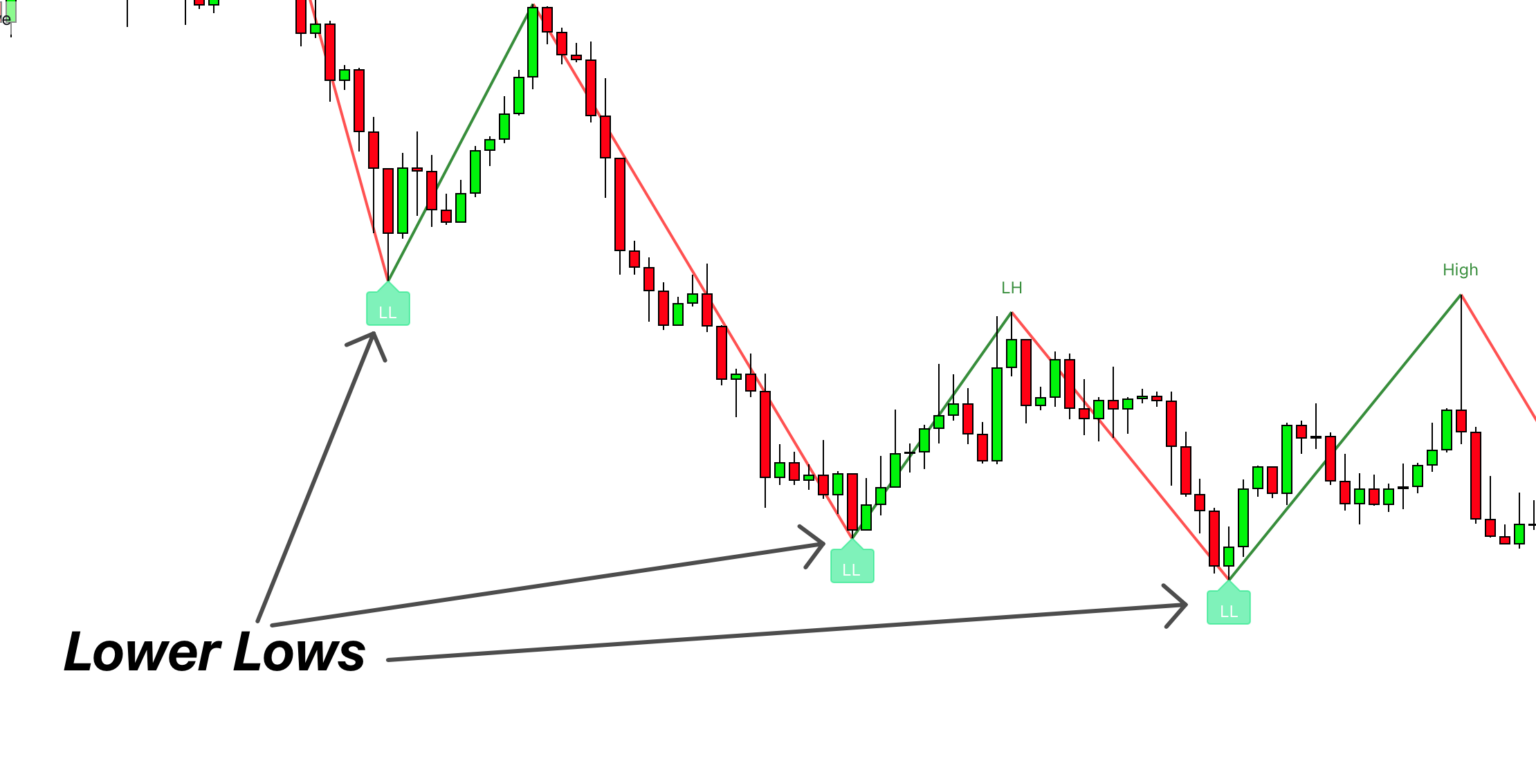
Lower lows (LL)
It is a downtrend market phenomenon in which the price of an asset reaches a further lower level in contrast to the previous day’s lower price. It is a clear and confident sign of a downtrend.
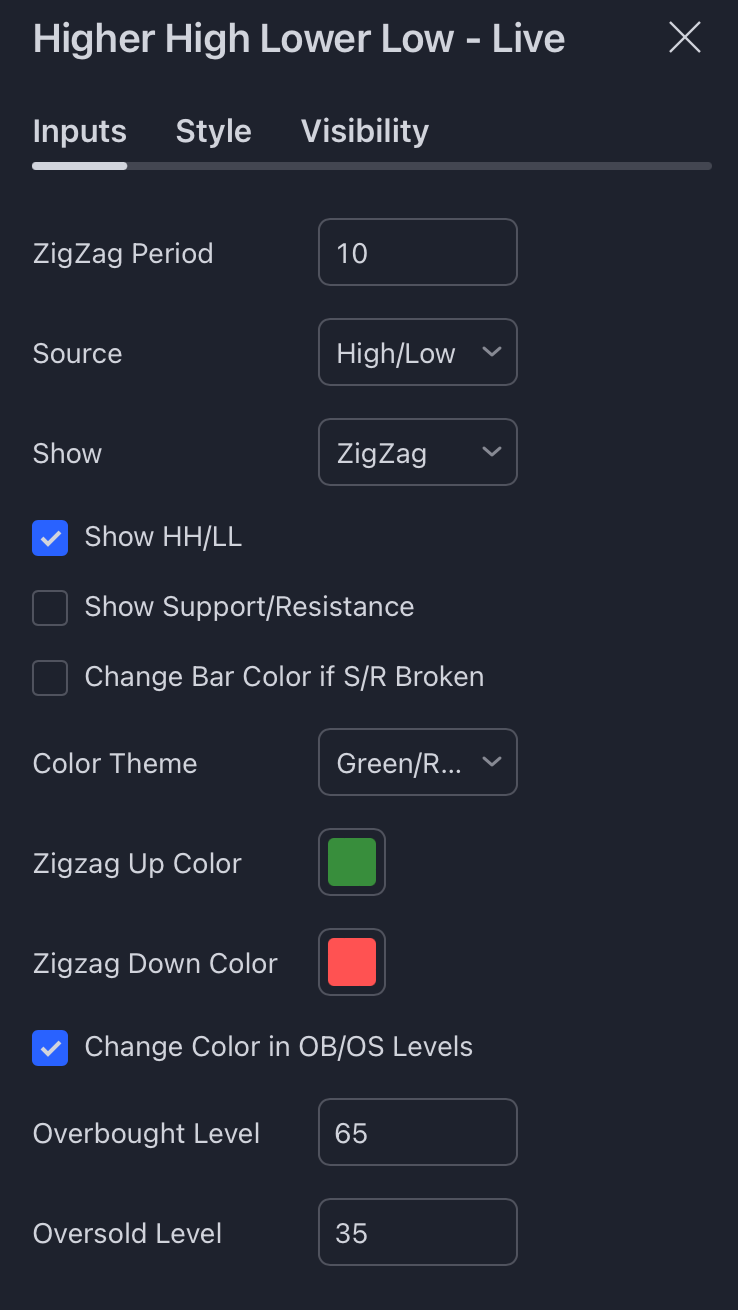
Best settings
The higher high and lower low indicator is based on the combination of zigzag indicator, overbought oversold indicator, and key levels.
- Overbought value is 65
- Oversold value is 35
- zigzag indicator value is 10
Trading strategy using the HH and LL indicator
The best way to trade with this indicator is by following the trend. You will have to follow the quote “Trend is your friend” and then trade in the direction of trend.
Entry and Exit
First of all, find the direction of the trend using the HH and LL indicator. Then find the two higher highs and higher lows for a bullish direction and look for buy opportunities using the bullish chart patterns or bullish candlestick patterns.
Now, each bullish trade will be a high-probability trade and it will have higher chances of success.
In case of bearish trend, you will have to look for the formation of two lower lows and lower highs. Then look for sell opportunities using bearish chart patterns or candlestick patterns.
Take profit
Now, there are two ways to exit a trade. The conservative way is by using exponential moving average crossover or by change of trend on the indicator. Then aggressive way is by using RSI divergence formation.
i will suggest you choose the conservative way to get maximum profit from a trade.
Risk management
Risk management is very crucial if you are dealing with higher high and lower low indicators. Always place your stop at the previous low point of the price. So, if the price takes a reversal, you don’t dry your account.
| Pros | Cons |
|---|---|
| It provides information about the uptrend and downtrend. | It shows mixed results. |
| It helps in generating trading signals. | It can create false signals. |
| It is a user-friendly indicator. | It requires the confluence of other technical trading tools for a confident strategy. |
| It provides a broad picture of the market. | |
| It is not based on complex mathematical formulas. | |
| It helps in the formulation of a trading strategy. |
Conclusion
The higher high and lower low indicator is a simple yet concise indicator. No doubt, it improves your trading knowledge and decision-making in the market. Yet, It is not your road to success or a key to fortune in the trading world. A wise trader will never ignore this indicator as it also shows previous market trends. So, always use this indicator as supportive knowledge in your decision-making instead of a 100% reliance on this indicator.

